As more and more IT infrastructures switch to the cloud, the need for public cloud security tools and log analytics platform has increased manifold. An organization generates a huge amount of data daily, which usually contains unstructured log. To structure these logs, the companies require an analysis tool. Elastic Stack is a complete log analysis solution that helps in deep searching, analyzing, and visualizing logs generated from different machines.
What is ELK Stack?
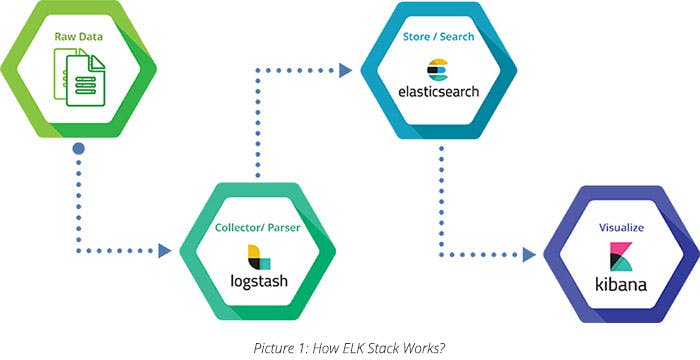
ELK is a combination of three open source tools: Elasticsearch, Logstash, and Kibana. All three tools are explained separately below:
- Elasticsearch is a NoSQL database which stores the data sent by Logstash. It is a highly flexible and distributed search and analytics engine that provides simple deployment, maximum reliability, and easy data management through horizontal scalability. It provides advanced queries to perform detailed analysis and stores all data centrally.
- Logstash collects various types of data from different sources and feeds it to Elasticsearch for further use.
- Kibana is a dashboard that acts as a visualization layer for easy search of Elasticsearch documents and provides insights. It also offers various interactive diagrams, geospatial data, timelines, and graphs to visualize complex queries using Elasticsearch. Kibana can help you create and save custom graphs according to your requirement.

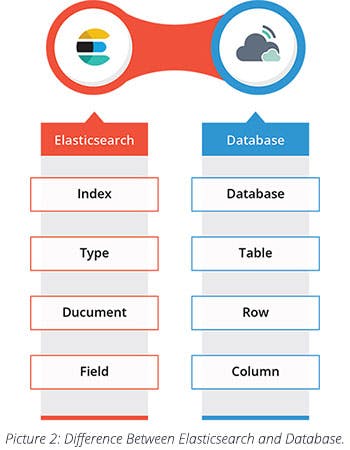
Elasticsearch: As a full-text distributed NoSQL database, Elasticsearch is a free, open-source tool that allows for real-time data search and analysis using documents instead of schema or tables. Some of its characteristics are:
- Built on top of Apache Lucene, a full-text search engine library.
- A Schema-free, REST & JSON-based distributed search engine with real-time analytics.
- Ongoing real time data.
- Scalability: Capable of scaling to hundreds of servers and petabytes of structured and unstructured data.
- Open Source: Apache License 2.0.
- Reliable.

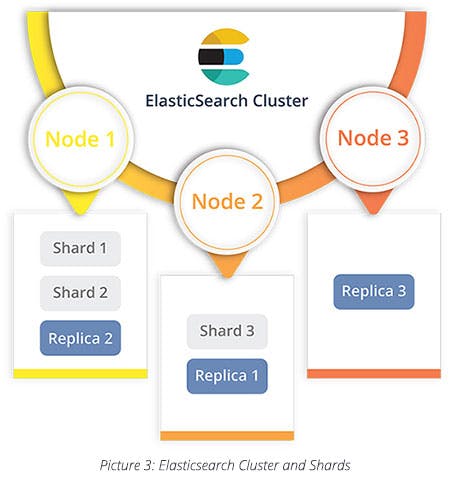
As a distributed search engine, Elasticsearch index is split into elements called shards. These shards are distributed across multiple nodes and are managed automatically by Elasticsearch. Following are some features of shards:
- A shard is a single instance of Lucene and is a complete search engine in its own right.
- Documents are stored and indexed in shards that are allocated to nodes in a cluster.
- As a cluster grows or shrinks, Elasticsearch automatically migrates shards between nodes to balance the cluster.
- A shard can be either a primary shard or a replica shard (a copy of a primary shard).
- Each document in your index belongs to a single primary shard.

ELK Plugins: There are a number of plugins available for Elasticsearch to make it more efficient.
- Alerting (Watcher) - Proactively monitors and alerts based on Elasticsearch queries or conditions.
- Security (Shield) - Protects and provides security to ELK Stack, like username and password. ELK Stack does not have any security by default.
- Monitoring (Marvel) - Monitors and diagnoses health and performance of Elastics cluster. It helps in checking if the master and nodes of ELK Stack are working fine.
- Graph - Discovers and explores the relationships that are live in data by adding relevance to your exploration.
- Search Guard - For authentication and authorization.
- SENTINL (For Reporting) - Once combined with Watcher, SENTINL helps in sending alert notifications based on Elasticsearch queries or conditions.
- Curator - For purging and deleting the indices.
Logstash Functionalities: As mentioned earlier, Logstash is used to collect data from different sources and sends it to Elasticsearch. Some of Logstash functionalities are listed below:
- Managing events and logs.
- Collecting data.
- Parsing data.
- Enriching data.
- Storing data.
How Logstash works?
Logstash configuration file location: /etc/Logstash/conf.d/Logstash.conf
input{
file{
path => (path of the file)
}
}
filter{
Apply filter based on the requirement
}
output{
Elasticsearch details go here
}
Logstash Filter Plugins:
- Grok – Parses unstructured event data into fields.
- Mutate – Performs mutations on fields.
- Geoip – Adds geographical information about IP addresses.
- Date – Parse dates from fields to use as Logstash timestamp for an event.
- Cidr – Checks IP addresses against a list of network blocks.
- Drop – Drops all events.
Logstash Output Plugins:
- STDOUT – Prints events to a standard output.
- CSV – Writes events to disk in a delimited format.
- Email – Sends an email to a specified address when output is received.
- Elasticsearch – Stores logs in Elasticsearch.
- Exec – Runs command for a matching event.
- File – Writes events to files on disk.
- MongoDB – Writes events to MongoDB.
While some organizations use ELK, there are a few who use EFK (Elasticsearch, Fluentd, and Kibana). ELK requires Beats (explained in the later section) to send logs to Logstash, whereas Fluentd itself runs a daemon set and sends log directly to Elaticsearch. Below are the differences between Logstash and Fluentd.
- Logstash: Part of ELK Stack.
- Fluentd: Part of CNCF (Cloud native computing foundation).
- Logstash: Does not offer any enterprise support.
- Fluentd: offers enterprise support.
- Logstash: Limited to an on-memory queue that holds 20 events.
- Fluentd: Highly configurable buffering system.
- Logstash: Windows and Linux, about 200 plugins on GitHub.
- Fluentd: Windows and Linux, about 500 plugins on GitHub.
- Logstash: Mostly used for collecting logs from different sources.
- Fluentd: Mostly used for microservices.
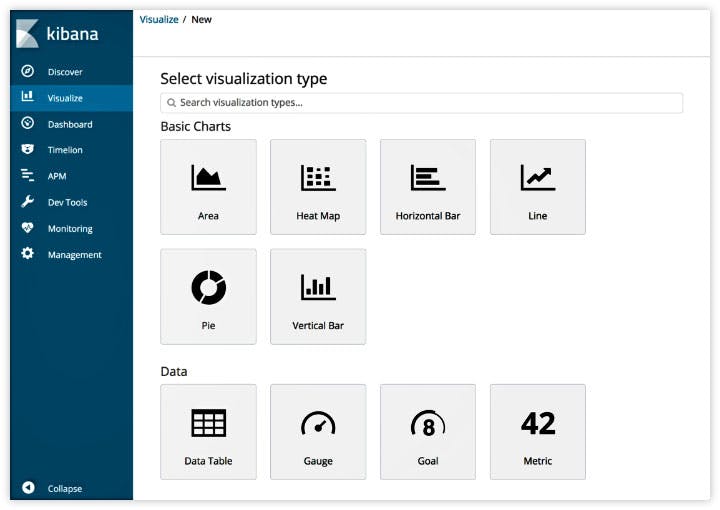
Kibana: Kibana is used for visualizing and analyzing data in a graphical way. Following are the features of Kibana. It helps in searching, viewing, and interacting with the data stored in Elasticsearch indices; execute queries on data and visualize results in charts, tables, and maps; add or remove widgets; and share/save/load dashboards (import/export).

Picture 4: Kibana Panel
Let me explain each component in the left panel in detail:
- Discover: Kibana helps in exploring the data, either document by document or through specialized queries.
- Visualize: We can create graphs, maps, and other types of visualizations using the data in our indexes.
- Dashboard: A Dashboard is a set of visualizations that are updated in real time and can be shared with the users outside the platform.
- Timeline: To check data on the basis of timelines. It is also known as time series data.
- APM: Application Performance Monitoring (APM) enables developers to check performance data for their applications.
- Dev Tools: Dev Tools page contains development tools that you can use to interact with your data in Kibana.
- Monitoring: It is used to check the live health status of Elasticserach, Logstash, and Beats.
- Management: it is used to perform runtime configurations in Kibana, including creating index patterns and advanced settings.
Beat: Collecting logs and metrics for ELK Stack
ELK stack has an essential component, called Beats, that helps in the collection of data to be sent to Elasticsearch of Logstash. There are different types of beats available to collect a variety of data and it runs in each node as a daemon set.
- Filebeat: Lightweight shipper for logs.
- Metricbeat: Collects metrics from your systems and services. From CPU to memory, Redis to NGINX, and much more.
- Heartbeat: Monitors services for their availability with active probing. Given a list of URLs, Heartbeat ships this information and response time to the rest of the Elastic Stack for further analysis.
- Packetbeat: It is a lightweight network packet analyzer that sends data to Logstash or Elasticsearch.
- Winlogbeat: Keeps a pulse on what’s happening across your Windows-based infrastructure. Winlogbeat live streams Windows event logs to Elasticsearch and Logstash in a lightweight way.
ELK stack can be implemented in almost all kinds of business structures as it has the capability of enhancing and visualizing the raw data. E-commerce is the talk of the town these days and with millions of transactions going simultaneously, it generates lots of data in the log format and requires cloud security tools. Implementing ELK stack in an e-commerce platform can yield very productive results as it can easily catch the fault captured in logs by giving it a proper format and visualization, thus, saving a lot of time and effort.


