Recommendation techniques have always played a very crucial role in marketing activities. The recommender systems have been available for a long time, but it is only recently that they have started being identified with e-commerce businesses. An example of a physical recommendation that retailers adopt is when they display a mannequin with their label clothing outside their shops. Such recommendations become a challenge in an online shopping scenario.
The objective of any recommendation system is to help the users find products or items that they want. In e-commerce, the system would present with a list of items to the user that they are most likely to buy. In such cases, the system must have all the information about the users (like their demography, previously bought items, channels of purchase, etc.) and the products (such as product attributes, prices, discounts available, descriptions, etc).
Prepare Your E-Commerce Stores to Own This Holiday Season
4 Categories of Recommender Systems:
- Non-personalized
- Content-based
- Collaborative filtering
- Hybrid systems
In this blog, we will focus on non-personalized recommender systems.
Non-Personalized Recommendations
While a personalized recommendation system suggests products to a user based on their previous purchase history, a non-personalized recommender system displays products that are popular among the people in general during that time period. By suggesting a product that the customer may potentially buy, a recommendation system also helps a website in creating their first impression of having the products that may be of the customer’s interest. There are various types of non-personalized systems depending on the customer’s usage.
Product Trending
You may have noticed various e-commerce websites showcasing trending products, or “Hot Items,” either on their home pages or at a corner of their product display pages. The main purpose of displaying these trending products is to keep the visitors engaged and get them converted into customers by constantly updating the products in real-time or near real-time. These products are updated within a time bucket that may range from 15 minutes to 2 hours or 4 hours. These time buckets are based on the rate of change of the products from a highly-sold product in a time window compared to the previous time window.
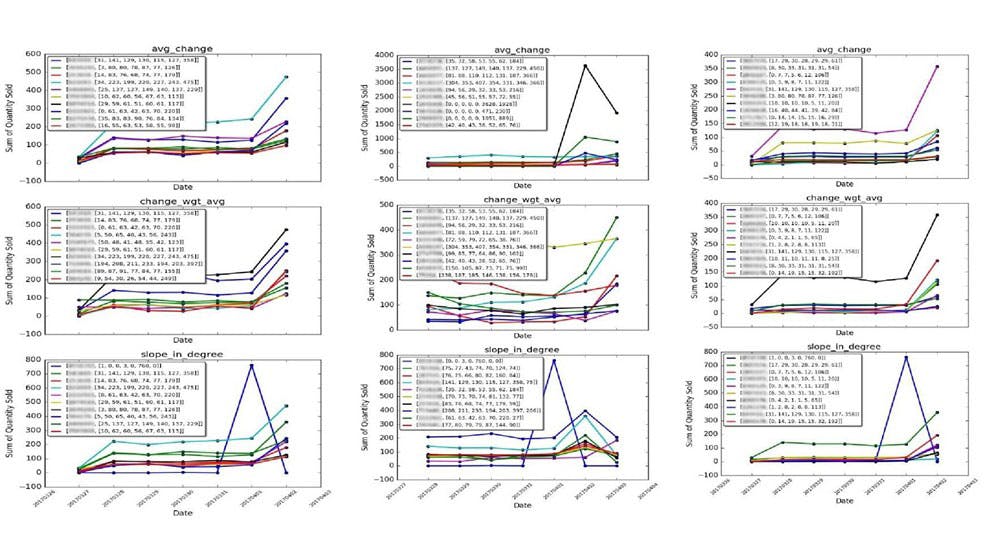
There are multiple flavors of trending algorithms. Three of them are explained below:
1. Average Change: Average of the difference in total sales within the time windows.
Average [ (total sale window0 – total sale window1), (total sale window1 – total sale window2) + (total sale window3 – total sale window2), ………….]
2. Weighted Average of Change: Weighted average of the recent three-time windows changes in total sales for a given period.
(total sale window0 – total sale window1) + 0.5*(total sale window1 – total sale window2) + 0.25*(total sale window2 – total sale window3)
3. Slope: Slope of the best fitting line representing the data points in degrees.

Fig.1. Comparing all 3 trending algorithms for 3 different time periods
The above figure shows the number of units sold in a time bucket of 4 hours. However, other metrics, such as views, clicks, total sales, or a number of times the product was added to the cart, can be used for trending. A friendly suggestion, always normalize the product pricing when using sales dollars on deciding metrics, if you don’t want to display only the high-priced items.
Product Ranking or Sequencing
Product sequencing, or ranking, helps in deciding the order that the products must be displayed on your web page. Whether it’s a home page, category page or a result page of any search query, the products that are being showcased must have a logical order. Intuitively, this order should be based on the likelihood of a product being clicked or bought by the customers.
Aggregate Metrics-Based Ranking
Many features can be used as a proxy for this likelihood. Some of them are listed below:
- Number of units sold
- Sales in dollars
- Number of views
- Number of clicks
- Number of times products are added to the cart
- Click-through rate
- Sell-through percentage
- Add-to-bag conversion percentage
- Number of reviews or ratings, etc.
These metrics are aggregated within a time duration, which is generally taken from 1 day to 2 weeks. General aggregations are a sum or an average. Again, don’t forget to normalize the product prices when using sales dollars as a deciding metric.
Prediction Based Ranking
In this technique, metrics are used to predict the product ranking for the next day with the help of historical data. The main advantage of this technique is that a trained model can help in ranking the rank according to their changing prices on a daily basis.
Various machine learning algorithms, like Linear Regression, Random Forest Regression, etc., can be used to train models to predict the next day sales using input features, such as historical sales in dollars, views, units sold, available stock, daily price, day of the week, month (for modeling seasonality), discount available, rating, number of reviews, number of clicks, etc.
Below are the ranking results from our prediction model using Gradient Boosted Machines (GBM).

Fig.2. Product ranking system using Sales Prediction (categories: Men’s Watches, Women’s Tops)
Explained above is one of the crucial tools of Non-Personalized Recommender systems. Its importance lies in the fact that it helps in creating your brand’s first impression on the new customers while serving the purpose of revenue maximization for the vendor.


