Boost Retention, Ratings & Revenue with Adobe Analytics for Mobile
Know why users come, stay, or leave—learn how Adobe Mobile Analytics helps you uncover deep insights, improve app ratings, and drive long-term retention and revenue.
Smart mobile teams are aware that the most important component for a successful five-star mobile app is not just limited to design. You need to thoroughly evaluate metrics, optimize your applications for your target goals, and iterate them to make your app successful. This is true no matter how you define success, be it a better brand, more money, or more engagement.
Adobe Analytics’ mobile application KPIs (Key Performance Indicators) track an app’s progress over time, from the early stages of development and marketing to the end products’ income. With the aid of app KPIs, you can evaluate the state of your company’s growth and take appropriate action. For instance, if your active users are declining, it can be a sign that your marketing plan is ineffective.
Your mobile app analytics metrics and KPIs should be reported on and reviewed often to increase income. How? By knowing how well your app is performing allows you to enhance it.
Why KPI Monitoring Matters
Monitoring KPIs are beneficial for determining your app's value. This is a fantastic technique to get the interest and support of potential customers, investors, and shareholders.
A well-planned KPI mechanism can answer the following business questions:
- What entices users to visit the mobile website or app?
- How long do visitors usually stay?
- What features do they use?
- Where do they run into issues?
- What variables are associated with decisions like purchases?
- What influences increased use and sustained retention?
Here are some benefits of having a solid KPI monitoring system in place:
- It offers context for making strategic decisions.
- It complements the financial statement results.
- It is a tool for monitoring and managing activities and the people who carry them out.
- It can track the variance between actual and anticipated results.
- It provides information for activity enhancement.
- It examines the consistency between the chosen actions and the goal.
Features of an Analytics-driven E-commerce Mobile App
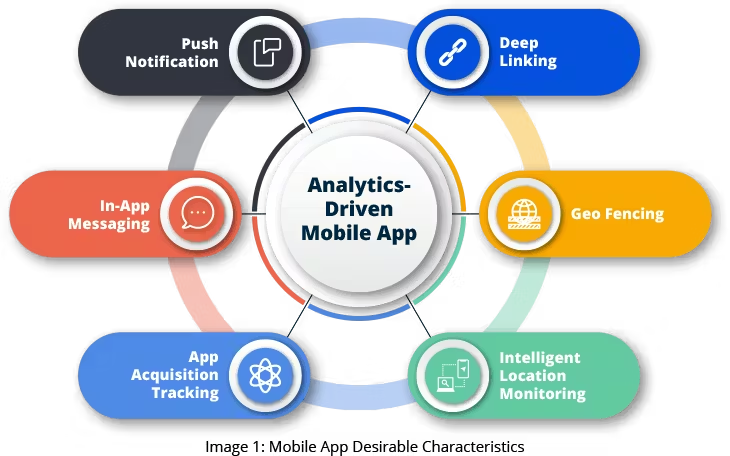
You may think of an analytics-driven mobile app to be a marketing toolkit that provides a bounty of information to boost business. Among other things, your mobile app needs to be focused on user acquisition, engagement, and retention. Image 1 summarizes the desirable features of a mobile app.
Some Challenges You May Face
You need data that provides more customized information to gain insights, segment consumers, and send pertinent marketing messages. However, a lack of consistency in the data from different sources frequently leads to profiles that are too fragmented to be of use.
Even though most businesses recognize the value of data protection, many choose to ignore it because of its complexity. Because big data security procedures are lacking in the retail sector, internal and external risks could affect consumer loyalty.
Organizations need data from all touchpoints to handle inventory accurately and assist the marketing and sales teams in demand forecasting. Collecting data from specific stores and internet stores is difficult for businesses. As a result, the Adobe Analytics tool is necessary for measuring essential statistics.
Maintaining a good customer experience might be challenging if you can contact customers both online and offline. Ensuring your consumers have a positive online experience is a top priority. This is only possible when you use tools like visitor monitoring, user behavior mapping, banners, and landing page impact measurement to help users find information more quickly.
For a great in-depth discussion of tracking KPIs in mobile apps, check out our blog: Attain 5 Star Ratings on Your Mobile Apps by Tracking Key Performance Indicators.
Adobe Analytics and Mobile App KPI Monitoring
Adobe Analytics is a data analytics tool from Adobe Experience Cloud that helps you collect and analyze omnichannel data. You can use this vital data to derive real-time insights, execute effective marketing campaigns, and build better customer experiences. Adobe Analytics is a robust web analytics platform that provides marketing analytics, attribution, and predictive analytics. With this tool, you can analyze mobile app metrics and improve your user journeys.
Is It the best fit for my business?
Depending on the size of your organization and its needs, using a powerful tool such as Adobe Analytics may be the right solution to your business needs. Table 1 presents you with a checklist of considerations. If your company has at least 50% of these needs, it might be worth considering using Adobe Analytics.
| Consideration | Check if Applicable |
|---|---|
| You must have fast and frequent access to data to perform analyses and obtain valuable insights. | |
| You engage in significant data sampling. | |
| You want to eliminate data silos and guarantee localization. | |
| You feel limited due to the constraints of your current tool. | |
| You have a sophisticated sales, analytics, and marketing infrastructure. | |
| You require an overall perspective of the client's journey. | |
| You need security that keeps your digital assets in compliance with all applicable security protocols and laws. |
It’s important to note that Adobe had an older platform called Adobe Experience Manager Mobile (AEM Mobile). This platform has gone end-of-life as of April 2021. Adobe recommends that mobile app developers use Adobe Analytics and the AEM Mobile Application Dashboard to achieve the desired KPI monitoring results.
What is the AEM Mobile Application Dashboard?
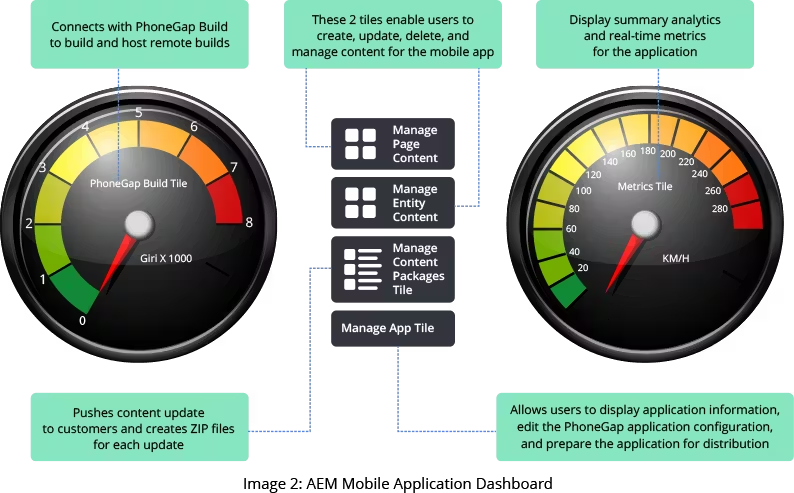
The AEM Mobile Application Dashboard is a comprehensive tool for managing mobile applications and their content. It is an interactive platform that facilitates the creation, building, deployment, and analysis of mobile applications. The dashboard consists of various "tiles," each serving a specific purpose, as shown in Image 2.
Using the Adobe Mobile Analytics SDK
To take full advantage of Adobe Analytics, use the Adobe Experience Platform Mobile Software Development Kit (SDK) when developing your mobile app. This DevKit is an analytical tool integrated into the Adobe Experience Platform Mobile SDK, providing comprehensive insights into user behavior and app performance.
The Adobe Mobile Analytics SDK provides the following:
- Data gathering for mobile channels: Gather thorough information for your mobile websites and applications across all major operating systems.
- Mobile engagement research: Gain insight into user activity on your mobile website, app, or video, including how frequently users launch the channel, if they make purchases there, and more.
- Mobile app dashboards and reports: Get use statistics that include app store analytics and lifecycle metrics for your apps. You can view trends in user numbers, app launches, average session lengths, retention rates, and crashes.
- Mobile campaign analysis: Analyze Adobe Campaign data to determine its level of success. Examples of these campaigns include SMS, mobile search advertisements, mobile display ads, and QR codes.
- Geolocation analysis: You can use the GPS location or locations of interest to determine where app users open and engage with your mobile experiences.
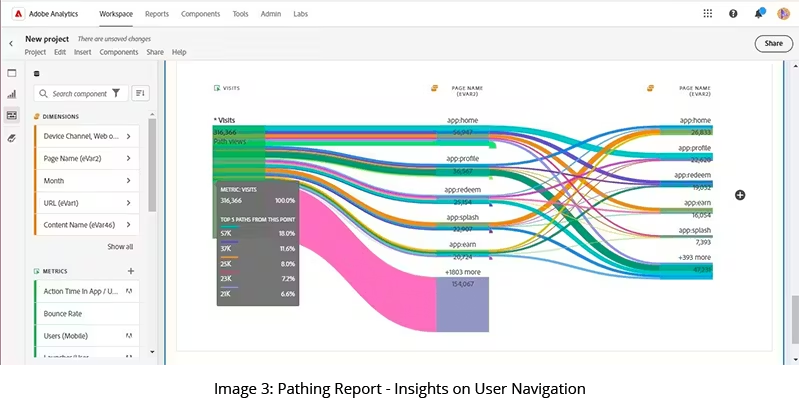
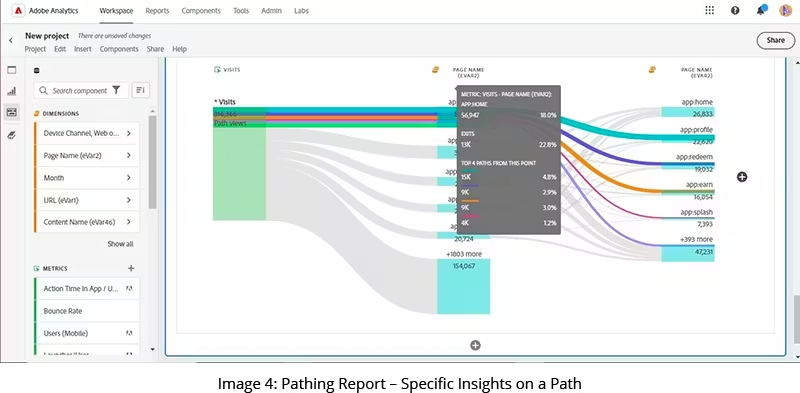
- Pathing analysis: Track users' movements across your app to see which screens and UI components motivate them to continue using it and which drive them away.
Integrating the SDK into Your App
The Adobe Experience Platform Mobile SDK partly powers Adobe's Experience Cloud services and solutions in your mobile applications.
The Mobile Core is the foundation of the SDK, which also includes several modular Adobe Experience Cloud solutions and third-party vendor extensions that rely on it. Extensions communicate with the mobile core to deliver capabilities unique to the product or service they represent.
Adobe provides Experience Platform Mobile SDKs for cross-platform development frameworks, iOS, and Android. The Data Collection UI manages SDK configuration, allowing for extendable, rules-based integrations and customization.
For AEM to track and report tracking data in your app, you must have an Adobe Analytics account. To complete the configuration, the AEM Administrator will first need to:
- Set up a Mobile Services report suite for your application and an Adobe Analytics account.
- Configure an Adobe Mobile Services (AMS) Cloud Service in Adobe Experience Manager (AEM).
To integrate the SDK into your app, you must configure ‘ContentSync’ to pull in the configuration file.
Instrument Code for Full App Tracking
The AMS Phonegap Plugin API offers multiple tracking APIs. These will enable you to monitor various conditions and behaviors, like the sites your users access within your application and the most frequently used features. The AMS plugin's Analytics APIs offer the simplest way to configure your app for tracking. Incorporate the ‘ADB.trackState()’ and ‘ADB.trackAction offers multiple tracking APIs. These will enable you to monitor various conditions and behaviors, like the sites your users access within your application and the most frequently used features. The AMS plugin's Analytics APIs offer the simplest way to configure your app for tracking. Incorporate the ‘ADB.trackState()’ and ‘ADB.trackAction()’ methods in your source code to gather comprehensive metrics for your application. offers multiple tracking APIs. These will enable you to monitor various conditions and behaviors, like the sites your users access within your application and the most frequently used features. The AMS plugin's Analytics APIs offer the simplest way to configure your app for tracking. Incorporate the ‘ADB.trackState()’ and ‘ADB.trackAction()’ methods in your source code to gather comprehensive metrics for your application.
Testing Analytics Tracking with Bloodhound
Bloodhound is an intermediary proxy tool, like Charles or Fiddler. You can set up your device to route all your traffic through Bloodhound, which is running on your computer. Because Bloodhound separates individual analytics from calls, it’s simple to identify an analytics datum related to recent activity, such as clicking a button or visiting a particular website.
Practical Tips, Advice, and Things to Avoid
This section presents practical tips, advice, and things to avoid. We provide practical advice from our experience with major customers while integrating Adobe Analytics into mobile apps.
Tips
The most critical tip our engineers shared was how vitally important it is for you to know Adobe Analytics! Make sure you are well-versed in Adobe Analytics' features before integrating. Learn about the essential terms, including events, ‘eVars,’ variables, and the report suite.
Here are some additional tips:
Prepare Your Execution
Clearly state in your mobile app what you wish to monitor and quantify. Plan for your implementation strategy, considering the events and variables you must record.
Employ a Tag Management System (TMS)
Consider using an Adobe Launch-style TMS. Analytics setups are made easier to manage using tag management, which streamlines the process of adding and updating tags without changing the app's code.
Proper Use of Mobile SDKs
Adobe offers mobile SDKs for widely used operating systems like iOS and Android. To guarantee a seamless integration, adhere to the documentation for your platform.
Leverage Custom Variables and Events
Use custom variables and events to record information pertinent to your application. This lets you monitor user behavior, interactions, and custom dimensions crucial to your analytics objectives.
Include Offline Tracking
If your program can run offline, you should include offline tracking. You can queue hits in Adobe Analytics and send them back once the device is online again.
Test and Validate
To guarantee correct data collection, thoroughly test your system in all scenarios. To ensure that data is being sent correctly, use Adobe's debugging tools.
Use Consistent Naming Conventions
Name variables, events, and other tracking items according to a consistent convention you establish and follow. This keeps your analytics configuration consistent and clear.
Pay Attention to Privacy Considerations
Before collecting personally identifiable information, be aware of user privacy laws and secure the required consent. Make sure to follow privacy rules such as the CCPA and GDPR.
Use Clear Communication and Documentation
Keep stakeholders updated on the specifics of your implementation and document them. Onboarding new team members, maintenance, and troubleshooting will all benefit from this material.
Things to Avoid
Adobe Analytics and the Mobile SDK provide you with a rich set of tools. However, as with any tool, it can be used properly or improperly. Misusing a mobile app analytics metrics platform can lead to a variety of adverse consequences.
The things to avoid include:
Overtracking
Avoid tracking pointless data by avoiding overtracking. Concentrate on key metrics and events to keep your analytics reports organized and relevant to your business objectives.
Standard Practices
Observe standard practices when developing mobile apps and take performance analytics into account. App performance can be adversely affected by excessive tracking.
Consistency
Make sure the data is consistent between platforms. If your software is accessible across several platforms, like iOS and Android, try to incorporate tracking consistently across those platforms.
Follow Requirements
Make sure your analytics configuration aligns with your changing business objectives by conducting regular audits. Tracking elements that are no longer relevant should be updated or removed.
Quality Engineering
Take note of the quality of the data. Deficient or erroneous information may result in poor decision-making. Regularly check the data and take quick action to resolve any disparities.
Practical Advice
On the positive side, our engineers have also provided some practical tips to help you build a solid implementation technique.
Keep Up to Date
Make sure that the Adobe Analytics SDKs and any associated tools are current. Adobe provides regular updates to fix issues, enhance functionality, or add new features.
Participate in the Community
Join Adobe Analytics-related forums, user groups, or communities. Interacting with the community can yield solutions, advice, and insights on common problems.
Track Server Calls
From your mobile app, track server calls using tools like Fiddler or Charles Proxy. This can assist in resolving any data communication problems.
Performance Considerations
Pay attention to how statistics affect the functionality of your app. Sustain a smooth user experience while balancing the requirement for thorough tracking.
Teamwork
Work closely with your app developers to ensure collaboration. A good integration depends on the analytics and development teams having effective communication.
Mobile-Related Adobe Analytics Reports
Collecting KPI data is of little use without proper reporting. This is an area where Adobe Analytics shines. Table 2 summarizes analytics reports and how they apply to mobile apps.
| Report | How it Applies to Mobile Apps |
|---|---|
| Overview Report | Condenses the main metrics into a single view |
| Users and Sessions Report | Shows distinct visitor metrics within the chosen period of time |
| Retention Report | Formerly known as the 'First Launch Cohorts Report,' the Retention Report is a cohort report that shows how many different users initially downloaded your app and subsequently did so at least once again in the following months. |
| Funnel Report | Shows when your mobile app users left off on a predetermined conversion path or abandoned a marketing campaign. You can use this report to compare the behaviors of various segments. |
| View Paths Report | The path analysis-based View Paths report shows a pathing graphic illustrating the routes followed within the app between states. |
| Action Paths Report | This report is based on path analysis and shows a pathing graphic that illustrates app users' routes from one state to another. |
| Versions Report | This ongoing report details the many iterations of your program active on a user's device. |
| Technology Report | Lets you view the various device kinds, operating systems, operating system versions, and mobile carriers where your app is used. |
| Crashes Report | Provides a summary of program crashes. You may log in to the Apteligent user interface and view the number and frequency of crashes. |
| App Store Overview Report | Displays your app store metrics, such as the total number of downloads, in-app purchases, average app store rating, download revenue, in-app revenue, downloads by nation, downloads by app shop, and in-app purchases by name, are all summarised in the App Store Overview report. |
Making the Best Use of Adobe Mobile Analytics
Utilizing Adobe Mobile Analytics, you can gather an abundance of useful metrics to track your app and measure various parameters.
App Launches, Upgrades, and Crashes
These statistics provide an overview of how well and how frequently your program is used. You can keep track of your app's launches, users across all versions, crashes, and other metrics. These indicators are typically the beginning point for mobile app measurement, coupled with overall income (if you provide a paid app).
Usage and Retention
Usage stats give you information about average session time, daily and monthly engaged users, upgrades, and other usage patterns for your app. User retention numbers are immediately available in retention reports the day after launch, seven days later, and then 28 days afterward.
Revenue
The income gathered by app stores and the revenue determined directly by in-app purchase events is shown. By using Customize Reports, you may get more cart analytics.
App Events
The KPIs you provide to gauge your app's success are app events. The KPIs you use will vary depending on the type of software you offer, from lifetime income to articles read and levels completed.
App States
States are the many perspectives that your app offers. Consider the pathways across your app that you wish to assess when defining states since states are displayed in a pathing report. For instance, from the first view, where do people most frequently navigate?
Location and Points of Interest
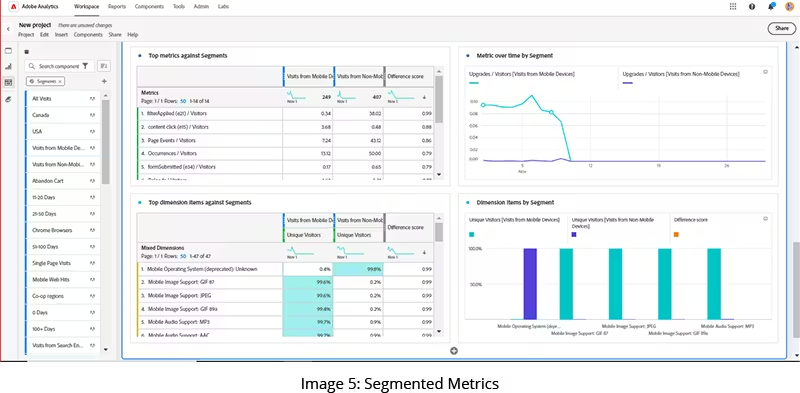
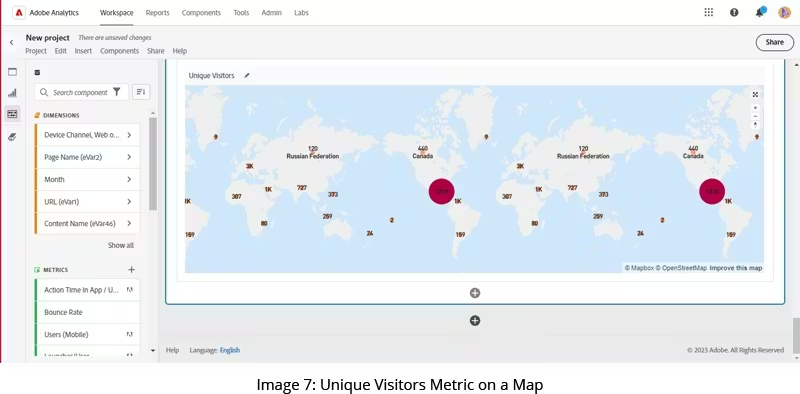
Many location-based reports are accessible if you enable GeoReporting in your Analytics report suite. GeoReporting's accuracy via Wi-Fi is comparable to that of a desktop web browser. Accuracy varies across a data connection depending on the provider and how requests are handled.
Lifetime Value
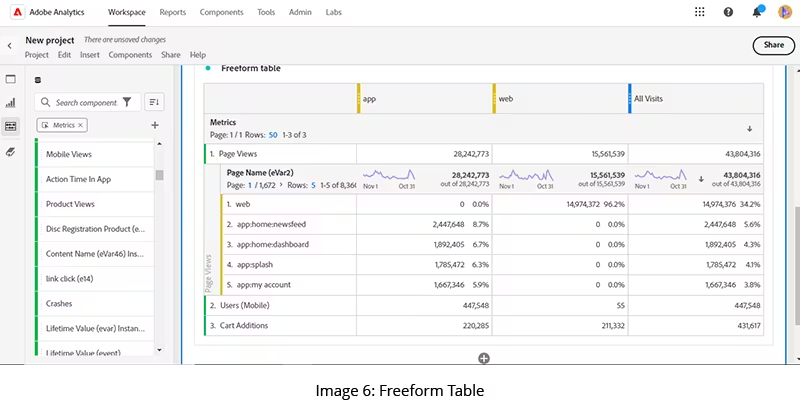
You may gauge a value with lifetime value so long as a user has your app loaded. Different in-app behaviors, positive or negative values, or an increase in lifetime value can all be assigned.
Time to Complete
Time to complete may be used with the KPIs you configure to track the time spent in a session and the time required to accomplish an activity across sessions. You might, for instance, track the amount of time between installation and the first in-app purchase.
Devices
You can see from device statistics which sorts of devices, operating systems, and mobile carriers users employ to access your app. You can use this information to segment reports and target content or to arrange support for the upcoming version.
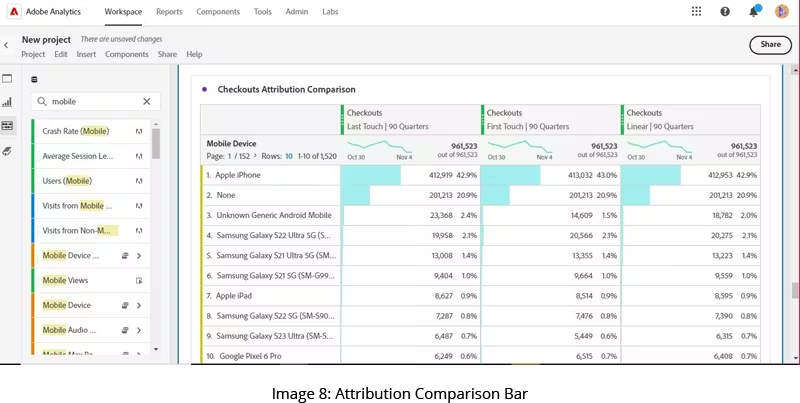
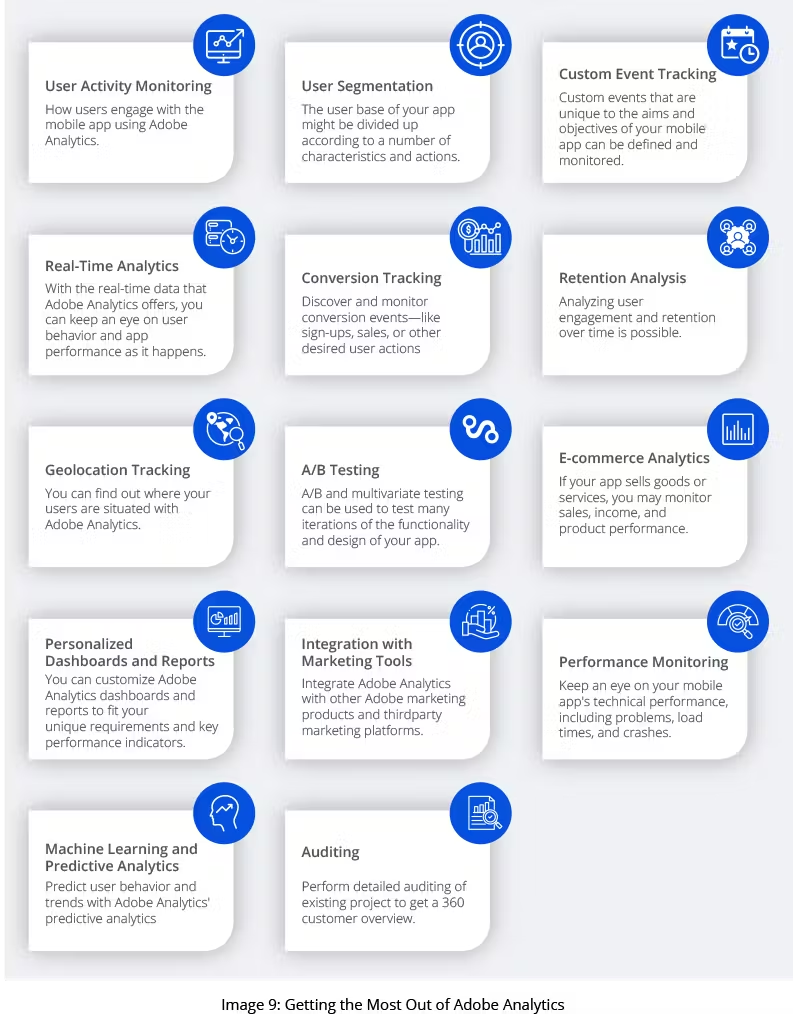
Image 9 summarizes vital areas where you can get the best out of Adobe Analytics in conjunction with mobile apps.
Best Practices for Retail
In addition to the general guidelines thus far described, here we present additional factors to consider for a retail environment.
Using the ‘eVars’ Variable
Making use of ‘eVars’ is the most complicated of Adobe Analytics' recommended practices. Data gathered by Adobe Analytics can be used to draw conclusions leading to wise business decisions. You can associate the value of a variable with a particular product or a specific event with the help of marketing variables.
You can use it to answer questions such as these:
- How can customers locate the items with the best margins?
- Are product suggestions or live search more valuable to your users?
- Which goods suffered the greatest revenue losses due to discounts?
Two categories of eVars exist:
- Product Syntax: This is the accepted e-commerce monitoring and reporting method in Adobe Analytics. It keeps track of product details such as color, size, name, quantity, delivery, special offers, and cost. When a merchandising value is available at the same time, consider using a product syntax eVar.
- Conversion Syntax: Using the conversion syntax, you can set a value other than the product string. When the qualities you want to bind aren't always present in the same hit as the targetted product, using a conversion syntax eVar is the only viable option.
Using the #Product String’ Variable
By looping over your data layer, snatching up all the product-related data, and formatting it in the appropriate syntax, the Adobe Analytics Product String Builder addon automatically sets the ‘#Product String’ variable for you.
The Product String Builder is one of the most important tools for tracking e-commerce data in Adobe Analytics. It is used to transmit product data in a predetermined manner, including product IDs, quantities, and other specifics. Adobe Analytics provides this string for proper e-commerce transaction recording and every tracking call. Adobe Analytics needs the product string's structure to properly analyze and present the data in reports.
Basic template:
;productName;quantity;price[,;productName;quantity;price...]
Commas separate information on each product, whereas semicolons separate product details.
Example:
;BlueShirt;2;19.99,RedShoes;1;29.99,GreenHat;3;9.99
In this example:
- Product 1 (BlueShirt) has a quantity of 2 and a price of 19.99.
- Product 2 (RedShoes) has a quantity of 1 and a price of 29.99.
- Product 3 (GreenHat) has a quantity of 3 and a price of 9.99.
Remember the following when putting the product string into practice, summarized in Table 3.
| Item | Explanation |
|---|---|
| Data Accuracy | Verify that each product's specifics are appropriately reflected in the product string containing the transaction data. |
| Data Consistency | Keep the product string uniformly formatted for all tracking calls to guarantee accurate data interpretation. |
| Dynamic Generation | Whenever feasible, create the product string dynamically using the items the user has in their cart at transaction time. |
| Validation | To identify any inconsistencies or mistakes, validate the product string regularly against real e-commerce transactions. |
| Documentation | For the benefit of developers, analysts, and other stakeholders, record how the product string is used and structured. |
Serializing Events
Regarding sales, submissions, checkouts, add-to-cart operations, or any other conversion event, data might occasionally mismatch in your back-end systems. Adobe Analytics fuses a distinct ID with each event iteration, eliminating the problem of double counting. Retailers who successfully deploy event serialization analytics can adaptably align diverse systems.
Segmentation
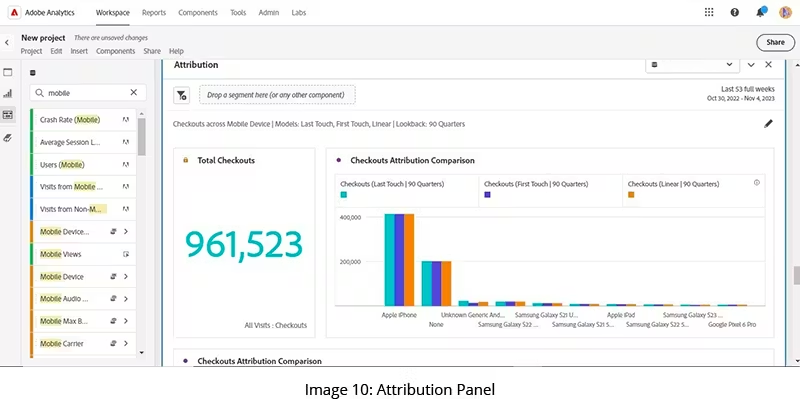
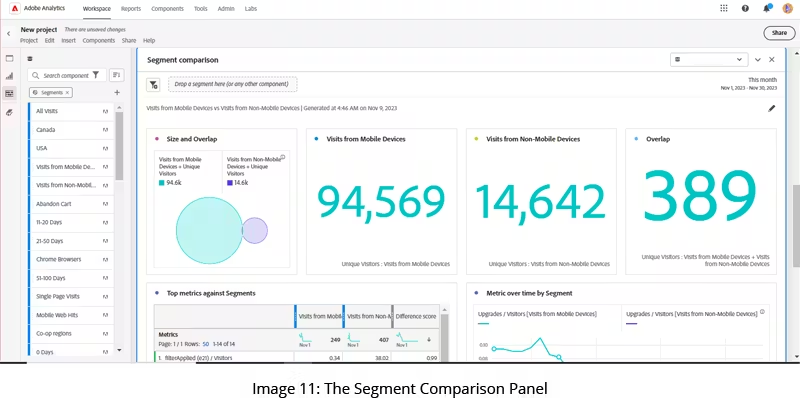
The reporting tool's segmentation is quite versatile. By automatically studying every metric and dimension, the Segmentation IQ tool enables you to identify statistically significant differences across unlimited segments. Automatically identify the market segments' main traits driving your business's KPIs. Adobe Analytics lets you build, manage, distribute, and apply impactful, targeted audience groups to reports.
The segmentation criteria listed here provide superior audience insights:
- By browser, device, number of visits, country, or gender
- By interactions such as campaigns, keyword searches, or search-related groupings
- By exits and entries from/to social media, landing page, or referring domain
- By custom variables defined from a particular field, defined categories, or a customer ID
Adobe Launch
Adobe Launch facilitates the integration of Adobe Analytics with Adobe Target, Adobe Audience Management, and Adobe Experience Platform. You can integrate Adobe Launch with a variety of technologies and use data to take action to create potent and memorable user experiences. The Adobe Experience platform uses tags as its present strategy. A tag management tool called Tags in Adobe Experience Platform enables you to deploy analytics code and other tagging requirements.
Set Up Alerts
You may generate and manage alerts using the Adobe Analytics tool to watch and monitor data continuously. Retailers can keep an eye on data abnormalities and preserve data integrity.
Build Calculated Metrics
Adobe Analytics' calculated metric tools provide a versatile approach to creating and managing metrics. They enable you to query the data as marketers, product managers, and analysts without altering your analytics implementation. The two most crucial computed metrics in digital analytics for businesses are conversion and bounce rate measurements. Due to the extensive audience segmentation, retailers must use extra computed metrics to enhance the study.
Import Product Costs
To improve the performance of the products, retailers must examine which ones generate the most income. To determine your most profitable items, Adobe Analytics includes a function that integrates product costs into the platform.
Advertising Analytics
Retailers may compare all Google and Bing Paid Search data simultaneouslyin Adobe Analytics using Advertising Analytics. You can use Advertising Analytics to analyze the same data by combining the data from these search engines in Adobe Analytics. Thanks to the integration of Advertising and Adobe Analytics, you can analyze and report metrics like impressions, clicks, costs, and quality ratings across dimensions like campaigns, Ad groups, and keywords.
Data Sources
Like Advertising Analytics KPIs, you can input ad campaign data to Adobe Analytics and process it for dimensions and metrics.
Personalized Calendar
Dividing the year into months based on a 4-5-4 week structure creates a retail calendar that serves as a roadmap for retailers that maintains sales compatibility between years. You can alter the calendar to suit your company's requirements.
Conclusion
Adobe Analytics provides many chances to successfully collect, organize, and visualize data. However, its biggest strength is the comprehensive view of a customer journey across all channels. The tool's capabilities go beyond simple measurement because it employs clever tactics to predict developments and subsequently make business choices that are data-generated and future-oriented.
However, the different pricing structures for the various packages may not be appropriate for start-ups and small businesses, which may prefer one of the free options. Additionally, getting acquainted with the instrument needs some background knowledge and, most importantly, time. However, Adobe Analytics will be a dependable ally in online marketing for those who can afford it and are ready to invest.


